FIRST MERCHANTS (FRME)·Q4 2025 Earnings Summary
First Merchants Delivers Record 2025 Results, Beats EPS as Acquisition Closes
January 27, 2026 · by Fintool AI Agent
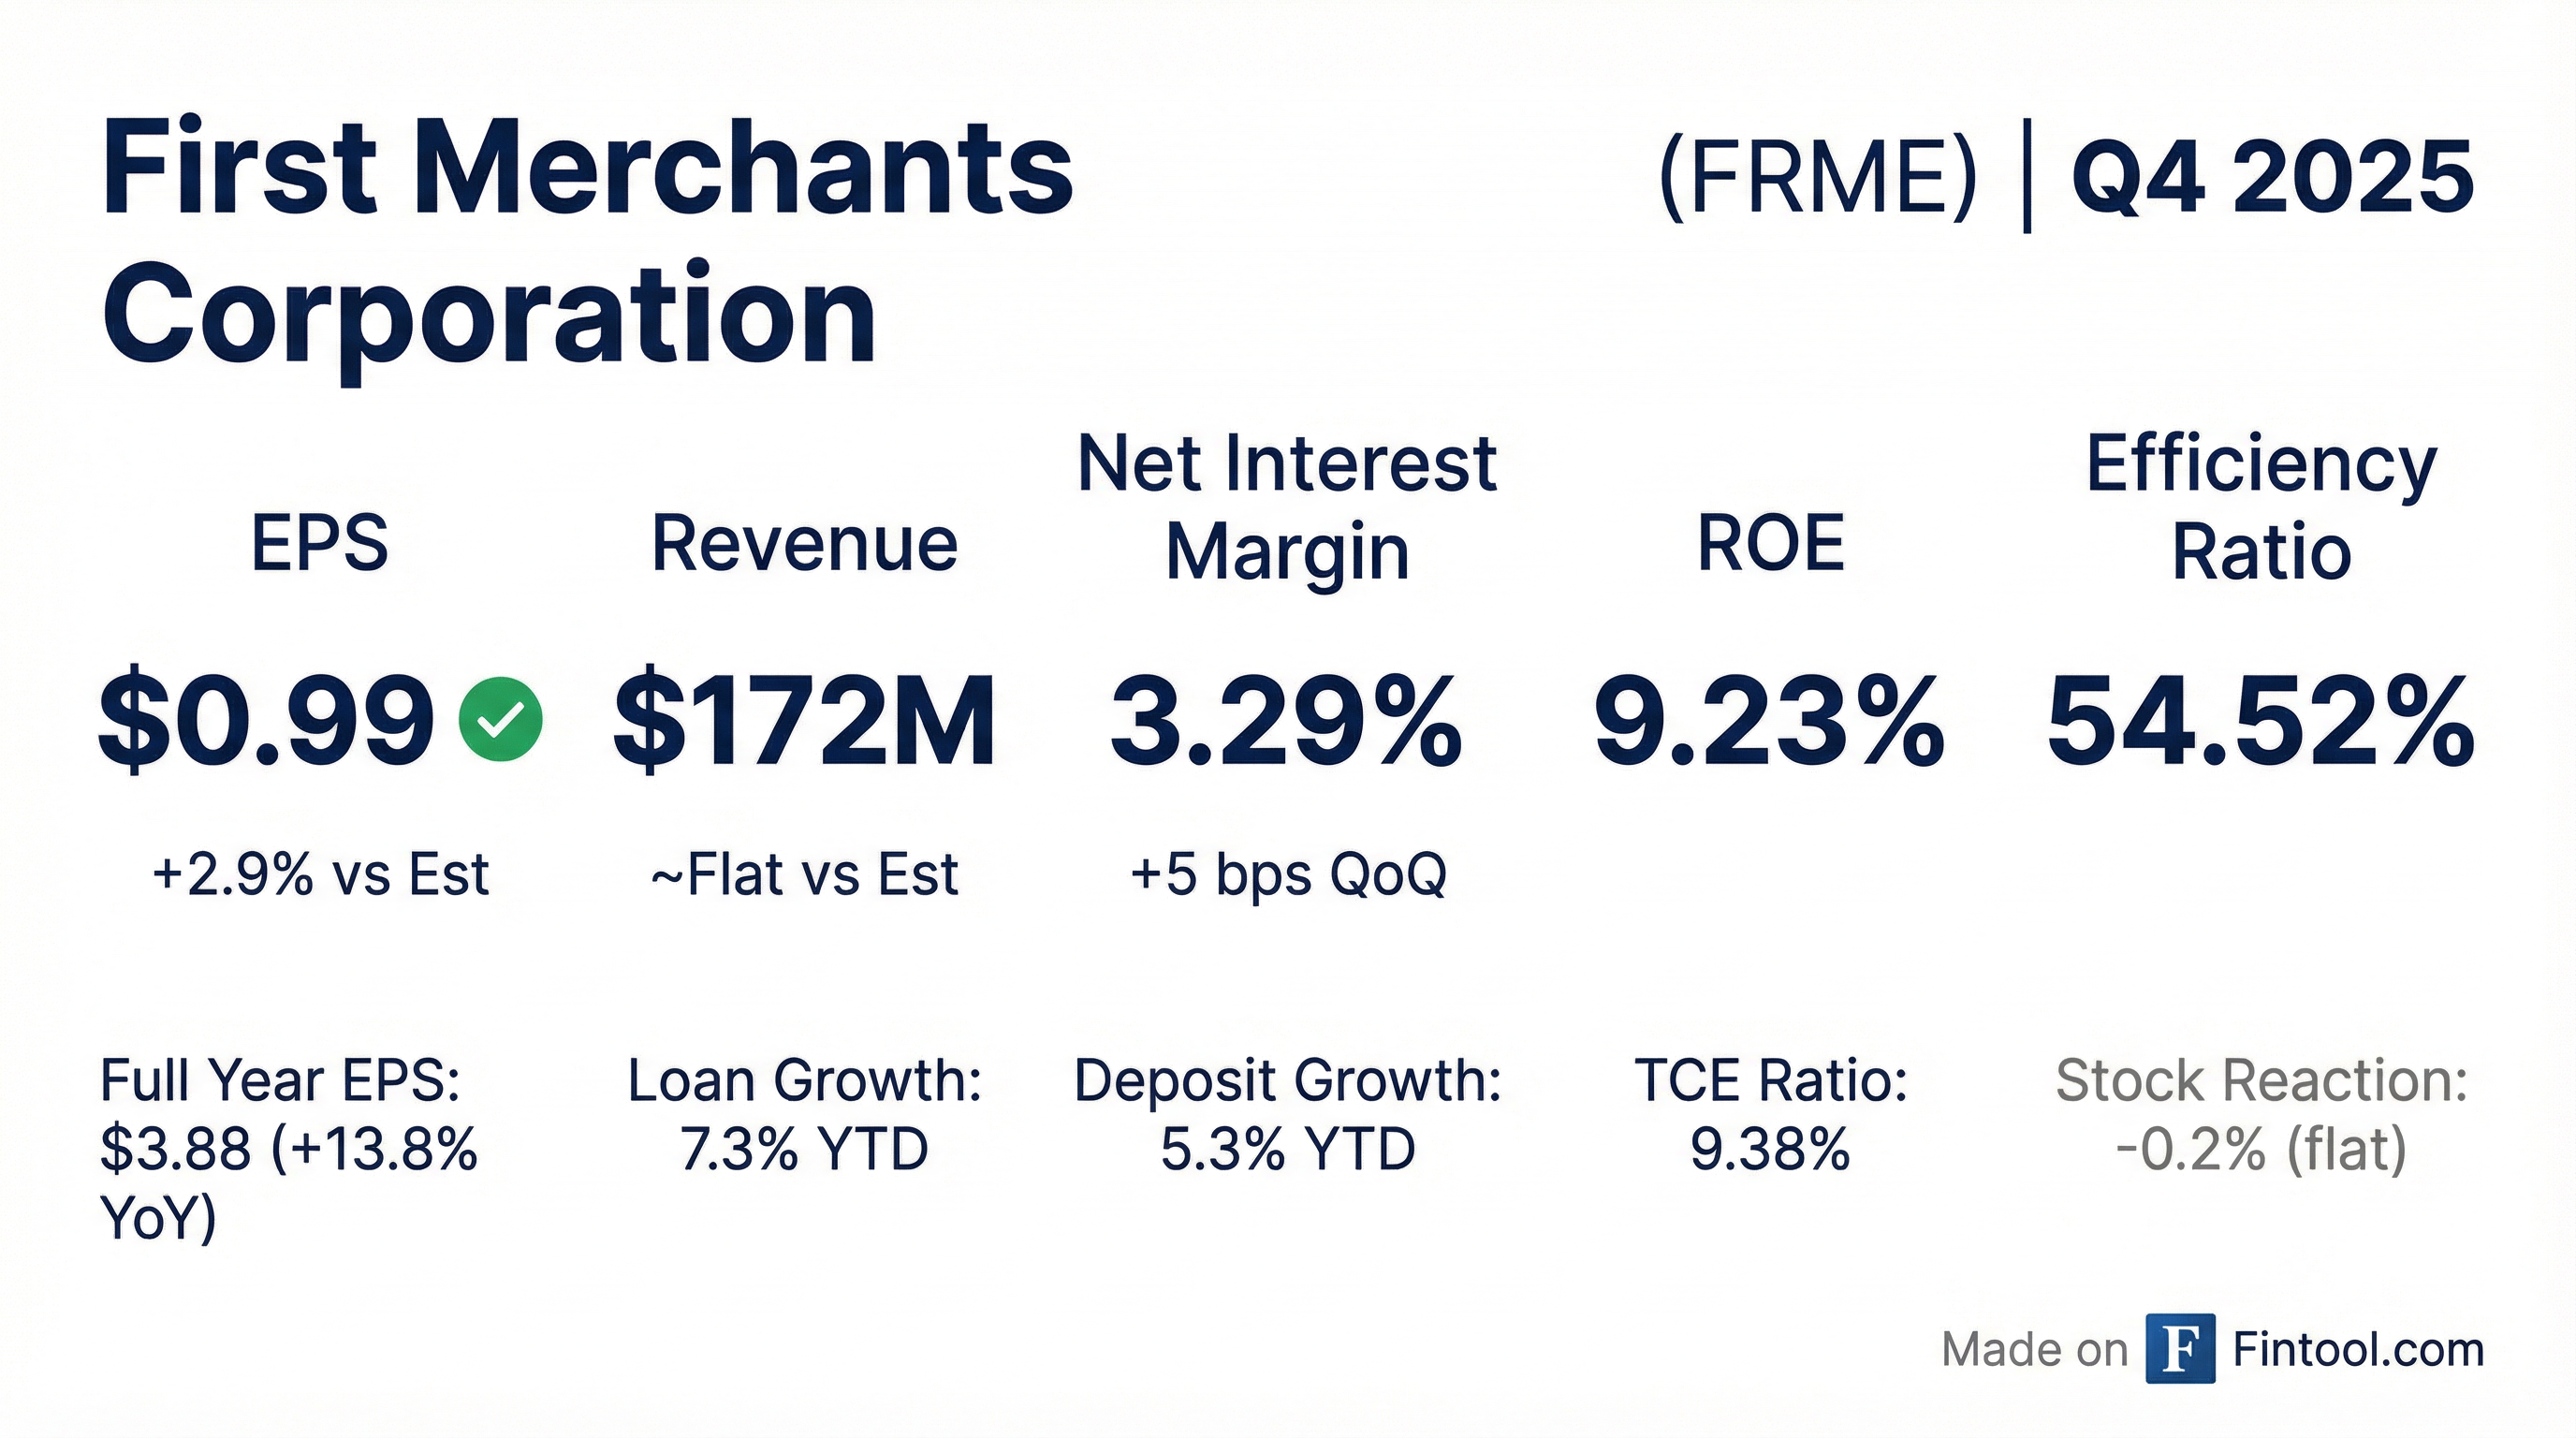
First Merchants Corporation (NASDAQ: FRME) reported Q4 2025 earnings that beat consensus expectations, capping off a record full year for the Indiana-based regional bank. Diluted EPS of $0.99 topped estimates of $0.96 by 2.9%, while revenue of $172.2 million came in essentially flat versus the Street . The stock was flat on the news, trading at $38.01 in after-hours.
The bigger story is the full-year performance: net income available to common stockholders reached a record $224.1 million with EPS of $3.88, up 13.8% from $3.41 in 2024 . CEO Mark Hardwick highlighted "record double-digit earnings and high single-digit loan growth" while noting that the pending First Savings Bank acquisition will close on February 1, 2026 .
Did First Merchants Beat Earnings?
EPS: Beat by 2.9% — Reported $0.99 vs. consensus $0.96. Adjusted EPS (excluding non-core items) was $0.98 vs. $1.00 in the prior year period .
Revenue: Flat — Total revenue of $172.2 million (net interest income of $139.1M + noninterest income of $33.1M) was essentially in line with expectations of $172.5M .
The beat was driven by higher net interest income ($5.4M higher than Q3), which benefited from a $3.3 million interest recovery on a resolved nonaccrual commercial real estate loan .
What Changed From Last Quarter?
Net Interest Margin expanded — NIM of 3.29% (FTE) increased 5 basis points from 3.24% in Q3 2025 . This marks the highest quarterly NIM of the year, supported by lower funding costs as interest expense on deposits declined.
Loan growth remained strong — Total loans grew $197.4 million (5.8% annualized) in Q4, bringing full-year growth to $938.8 million or 7.3% . C&I lending continued to lead with $135 million of quarterly growth.
Deposits accelerated — Deposits increased $424.9 million (11.4% annualized) in the quarter, improving the loan-to-deposit ratio to 90.3% from 91.6% . Consumer deposit growth was particularly strong with $155M quarterly increase and $250M+ in non-maturity balance growth .
Credit metrics stable but mixed — Provision for credit losses was $7.2 million vs. $4.3 million in Q3. Net charge-offs of $6.0 million (18 bps annualized) increased from $5.1 million. NPAs/assets rose slightly to 0.38% from 0.36% .
How Did the Stock React?
The stock was essentially flat on the earnings release, closing at $38.01 on January 26 (down 0.2% from the prior close of $38.09). This muted reaction suggests the results were largely in line with expectations after the recent strong performance — FRME shares are up 10.4% from the 52-week low of $33.13.
Key trading context:
- 52-week high: $45.62
- 52-week low: $33.13
- Current price: $38.01
- Market cap: $2.2 billion
- P/E (LTM): 9.6x
- Price/Tangible Book: 1.24x
What's the Acquisition Update?
The headline strategic development is the imminent closing of the First Savings Financial Group acquisition:
- Regulatory approval received — Deal closes February 1, 2026
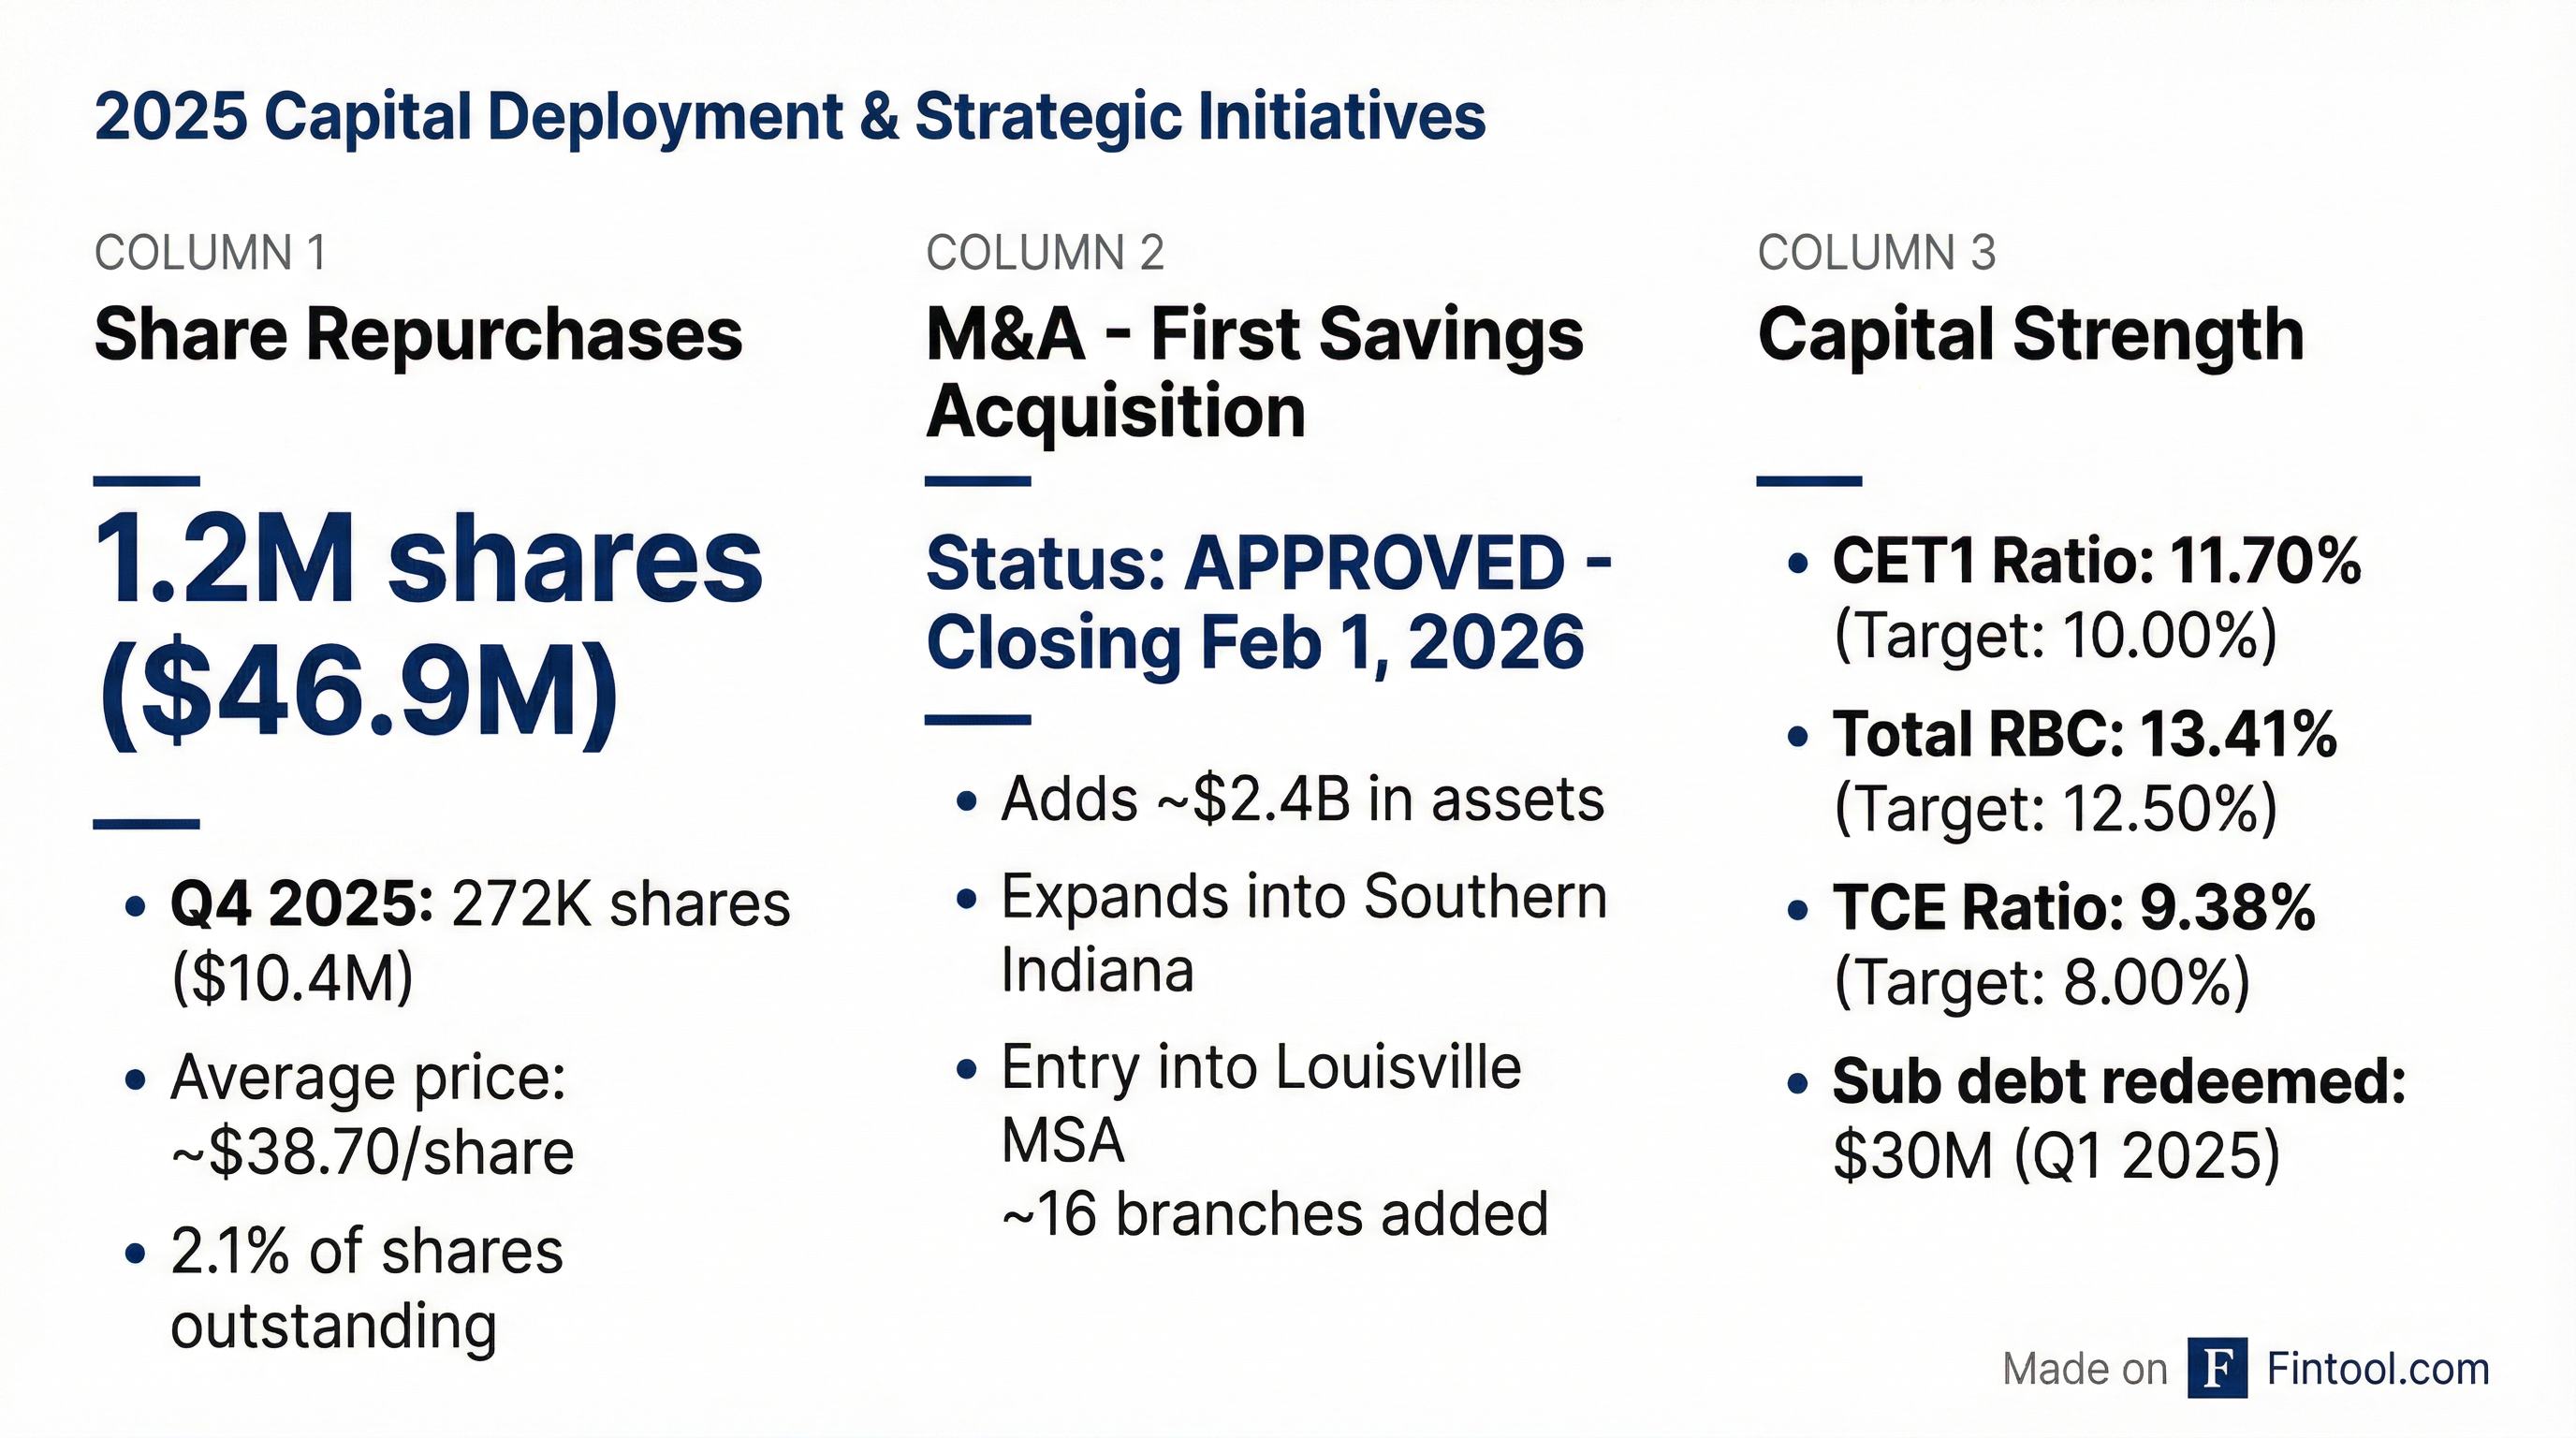
- Asset addition: ~$2.4 billion in assets
- Geographic expansion: Southern Indiana and Louisville MSA entry
- Branch count: Adds 16 branches to FRME's 111 existing locations
This acquisition solidifies First Merchants as the largest financial services holding company headquartered in Central Indiana and positions them as #6 in Indiana deposit market share pro forma .
Capital Position and Shareholder Returns
First Merchants maintained a robust capital position while returning significant capital to shareholders:
Capital ratios (all above targets):
- Common Equity Tier 1: 11.70% (target: 10.00%)
- Total Risk-Based Capital: 13.41% (target: 12.50%)
- Tangible Common Equity: 9.38% (target: 8.00%)
Shareholder returns:
- Share repurchases: 1,211,224 shares totaling $46.9 million YTD
- Q4 repurchases: 271,953 shares for $10.4 million
- Dividend: $0.36/share (3.8% yield at current price)
- Tangible book value: $30.18/share, up $3.40 or 12.7% YoY
Long-term value creation (2015-2025):
- Tangible Book Value CAGR: 7.5% (8.5% adjusted for AOCI)
- Diluted EPS CAGR: 8.5%
- Dividends per Share CAGR: 13.3%
Key Management Commentary
CEO Mark Hardwick emphasized the strong positioning heading into 2026:
"First Merchants delivered record double-digit earnings and high single-digit loan growth in 2025. Our capital, liquidity and credit positions remain very strong and position us for continued success. The pending completion of the First Savings Bank acquisition on February 1st will further enhance our state-wide Indiana presence."
On talent investments (from earnings call):
"We were pretty aggressive with the 2026 plan about just continuing to invest in people... we're just finding opportunities to add talent that we're really excited about... If it were just standalone, maybe we'd be a little less concerned... But on a combined basis, I think we're going to produce the kind of results that you're used to seeing from us."
President Mike Stewart on loan growth drivers:
"It's across the board when I think about geography or when I think about our segments... Our new asset-based team that we talked about a couple of quarters ago has been off and running and producing fantastic results."
Full Year 2025 Highlights
Investment Portfolio & Deposit Composition
Investment portfolio ($3.4B):
- Municipal bonds: 57% (AA-rated)
- Mortgage-backed securities: 25%
- U.S. Agencies: 11%
- Effective duration: 5.6 years
- 12-month cash flow: $282M at 2.09% yield
Unrealized losses (improving with rate cuts):
- Available for Sale: $166.9M (vs. $196.9M prior Q)
- Held to Maturity: $253.5M (vs. $288.7M prior Q)
Deposit characteristics (key post-SVB metrics):
- Core deposits: 91%
- Noninterest-bearing: 14%
- Insured: 71.4% / Uninsured: 28.6%
- Deposits yielding 0-5 bps: 33% of total
- Average account balance: $38,000
Loan Portfolio Health
The commercial loan portfolio showed continued strength:
Portfolio composition (76% commercial-oriented):
- C&I (including owner-occupied): $5.97B (43% of loans)
- CRE Non-Owner Occupied: $2.34B (17%)
- Construction: $805M (6%)
- Residential/HELOC/Consumer: $3.31B (24%)
CRE concentrations remain below regulatory thresholds:
- CRE Construction: 38.8% (vs. 100% threshold)
- CRE Total: 151.7% (vs. 300% threshold)
Office exposure limited:
- Total office NOO: $261.2 million (1.9% of total loans)
- Top 10 loans represent 52% of office portfolio with weighted average LTV of 59.3% at origination
Sponsor Finance portfolio ($897.5M to 97 companies):
- Senior Debt/Adj. EBITDA < 3.0x: ~83%
- Total Debt/Adj. EBITDA < 4.0x: ~75%
- FCCR > 1.50x: ~70%
- Classified: ~4.4% of portfolio
- 10-year track record: $19.3M losses on $2.05B funded (0.9% cumulative loss rate)
Credit Quality Trends
Credit metrics remained stable with some normalization in charge-offs:
Largest nonaccrual loans:
- $12.9M IRE Multi-family Construction (paid off January 8, 2026)
- $9.6M IRE Multi-family Construction
- $4.3M C&I Contractor
Forward Catalysts
Near-term (Q1 2026):
- First Savings acquisition closing February 1, 2026 — immediate ~13% asset boost
- Balance sheet optimization: Selling entire First Savings bond portfolio (~$250M)
- Integration planning underway; system conversion scheduled for May 2026
- CD repricing tailwind: ~$800M in H1 2026 at 3.65-3.75% vs. current specials at 3.30-3.45%
Medium-term:
- 27.5% annualized cost savings from First Savings (full realization post-May integration)
- Geographic diversification benefits from Southern Indiana/Louisville entry
- Talent acquisition opportunity from Fifth Third/Comerica disruption in Michigan
- Continued share repurchases at current valuation levels
Risks to monitor:
- Integration execution risk with First Savings
- Commercial real estate (especially multi-family construction) credit quality
- Net interest margin compression if Fed cuts accelerate
- Q1 seasonal margin dip (~5 bps) from day count impact
What Did Management Guide for 2026?
Management provided detailed forward guidance during the earnings call :
CD Repricing Tailwind — CFO Michele Kawiecki detailed the opportunity :
- Q1 2026: ~$400M maturing at 3.75% WAR (current 12-month special: 3.30%)
- Q2 2026: ~$400M maturing at 3.65% WAR (9-month special: 3.45%)
- Q3 2026: <$400M maturing at rates in line with current specials
- Q4 2026: Minimal maturities
Fixed-Rate Loan Repricing — ~$350M maturing in 2026 at 4.40% rate provides additional upside .
Q&A Highlights: What Analysts Asked
On Balance Sheet Optimization (Brendan Nosal, Hovde Group) :
Management confirmed they will sell the entire First Savings bond portfolio (~$250M at close). Beyond that, any additional actions would be "relatively small" and focused on relieving liquidity pressure — potentially selling lowest-yielding bonds and loans. CEO Hardwick emphasized no capital raise is needed: "There would be no need to raise any type of capital."
On M&A Disruption Opportunity (Nathan Race, Piper Sandler) :
With Fifth Third acquiring Comerica, FRME sees opportunity in Michigan:
"We're thinking about our Michigan market where you've got Fifth Third and Comerica, and we view it as an opportunity... The conversations are happening... We know who the talent is. We understand the talent that we think would be great to add to our team, and we're already having conversations there as well." — President Mike Stewart
On Buyback Strategy (Nathan Race) :
CEO Hardwick was direct: "I don't have any desire really to see our TC grow above the current levels... We intend to be aggressive with buybacks as long as the price holds where it is."
Post-acquisition, TCE will drop from ~9.40% to ~8.70-8.80%, still well above the 8% target.
On Multifamily Credit (Terry McEvoy, Stephens) :
CCO John Martin addressed the two nonaccrual multifamily construction loans: "It's not some wholesale problem. For the most part, we've seen those assets stabilize and moved into the permanent market." The issues were driven by higher rates and "disagreement amongst partners and the strategy."
On NIM Seasonality (Brian Martin, Janney) :
CFO Kawiecki noted Q1 margin typically sees ~5 bps compression from day count impact on commercial loans. The Q4 interest recovery added ~8 bps to reported margin, so core Q4 NIM was ~3.21%.
Operating Leverage Outlook
Management provided context on expense discipline :
Headcount Management:
- 2023 (post-voluntary retirement): 2,145 FTEs
- Current: 2,035 FTEs (down 5%)
- 2025: Added ~15 FTEs ($4M expense)
- 2026: Plan to add ~10 FTEs (<2% increase, $2.5M expense)
Operating Leverage Path:
- Core basis: "A little less impressive" given talent investments
- Combined basis: Strong operating leverage expected due to acquisition synergies
- Cost savings: 27.5% annualized from First Savings, realized post-May integration
CEO Hardwick: "On a combined basis, I think we're going to produce the kind of results that you're used to seeing from us."
Conference Call Recording
The Q4 2025 earnings conference call was held on Tuesday, January 27, 2026 at 9:00 AM ET.
Data sourced from First Merchants Corporation 8-K filing, Q4 2025 Investor Update presentation, and earnings call transcript dated January 26-27, 2026. Analyst estimates from S&P Global.